Border Wait Times have become harder to read from a single number because 2026 data points in different directions by corridor, travel mode, and time of day. Northern crossings saw clear July growth in personal-vehicle traffic, while Mexico-to-U.S. personal-vehicle entries dipped slightly in the same month. For travelers, the practical lesson is not that every crossing is getting worse. It is that a trip plan should allow for sharper peaks, inconsistent same-day reports, and the possibility that one port can be manageable while another nearby crossing backs up for hours.
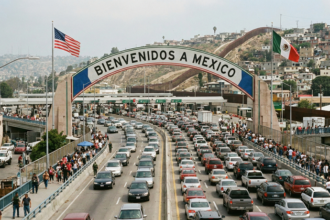
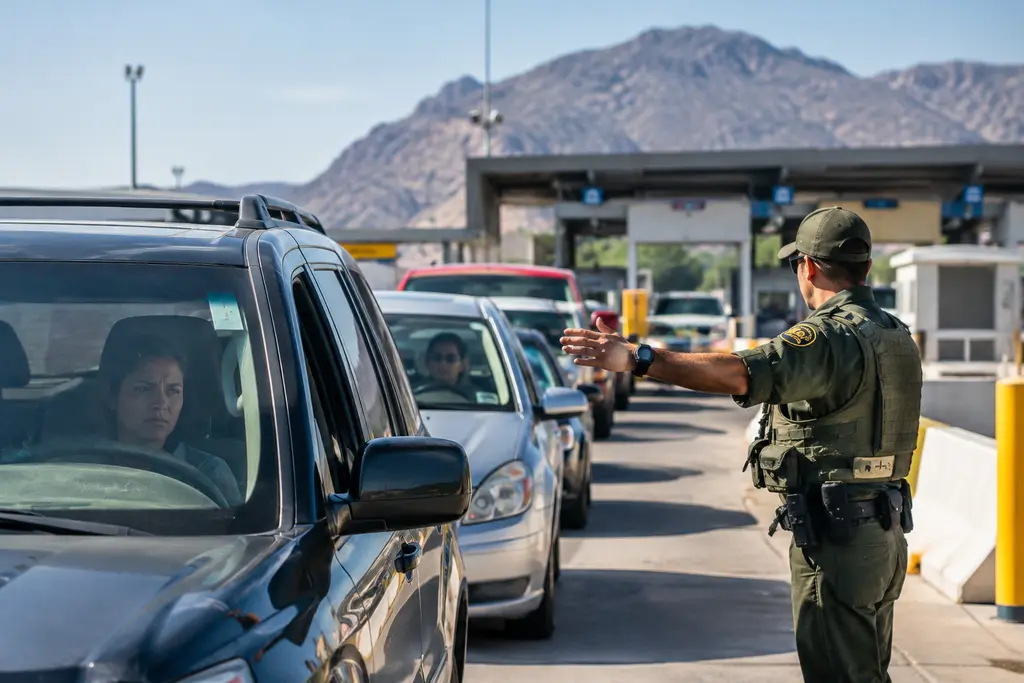
The late-October snapshots available in the research show why caution matters. On October 21, 2026, the longest reported passenger-vehicle wait from Mexico into the United States was 50 minutes at Calexico West in California. Five days later, on October 26, 2026, a separate same-day snapshot reported much heavier delays, including 280 minutes at Otay Mesa, 160 minutes at San Ysidro, and 120 minutes at San Luis I. Those figures should not be treated as a forecast for every day. They are a reminder that land-border planning needs a buffer, especially for airport connections, medical appointments, hotel check-in deadlines, and long-distance drives after inspection.
What The 2026 Data Says About Border Wait Times
Border Wait Times And Volume Growth
The clearest official signal comes from July 2026 border-crossing volume data. The Bureau of Transportation Statistics reported that personal-vehicle entries from Canada into the United States rose 9.4% in July 2026 from July 2025, reaching about 2,124,296 entries. The same release reported a slight 0.8% year-over-year increase in pedestrians entering from Canada, totaling about 3,570,046, while personal-vehicle entries from Mexico into the United States fell 1.6% to about 6,240,982 in July 2026. Bus crossings, however, were down nearly 30% from July 2025, according to the Bureau of Transportation Statistics release.
Those numbers are useful, but they are not a live wait-time board. Volume data shows pressure on a corridor over a month; it does not tell a driver what will happen at 4 p.m. on a Friday. A crossing can process fewer vehicles than last year and still experience a severe backup if traffic arrives in a short window, lanes are limited, or inspection demand rises. That is why travelers should read volume trends as background, not as a promise of an easy crossing.
Why One Month Of Data Does Not Set Your Trip Time
For Mexico-to-U.S. trips, the July decline in personal-vehicle entries does not mean travelers can ignore delays at busy California and Arizona ports. The October 26 snapshot cited in the research showed Otay Mesa and San Ysidro with long passenger-vehicle queues on the same day. For Canada-to-U.S. trips, the July rise in personal-vehicle entries suggests more demand in some northern corridors, but it still does not identify the exact hour when a traveler should cross.
The safer approach is to separate three questions. First, is the corridor seeing higher or lower demand compared with last year? Second, what is the same-day reported wait before departure? Third, what happens if the crossing takes two or three hours longer than planned? That third question is the one many road-trip plans skip.
How To Plan Around Border Wait Times
Build A Buffer Before The Border, Not After It
Travelers often place the buffer on the wrong side of the crossing. If a hotel, airport, ferry, tour, medical visit, or family commitment sits immediately after the border, a delay can affect the rest of the day. A better plan is to create flexibility before arrival at the port of entry: leave earlier, avoid stacking major commitments after inspection, and keep meals, fuel, and restroom stops from becoming urgent while already in line.
This is especially relevant at high-use California crossings such as Otay Mesa, San Ysidro, and Calexico West, and at Arizona crossings such as San Luis I, because the research snapshots show they can differ sharply by date. A 50-minute longest wait on October 21 and a 280-minute longest wait on October 26 are not contradictions; they are evidence that same-route planning can change quickly.
- Check same-day reports before committing to a specific port or departure hour.
- Keep fuel, medication, water, and child-care needs handled before joining a long queue.
- Avoid booking tight airport connections immediately after a land crossing.
- Use explicit dates and times in your plan rather than relying on a general idea of a “normal” wait.
- Have a backup plan for late hotel arrival, missed meals, or a longer drive after inspection.
Pair Road Planning With Arrival Planning
Border delays can feel similar to airport immigration delays in one practical way: the inspection line is only one part of the trip. After the crossing, travelers may still face city traffic, rental-car returns, airline check-in cutoffs, or a long drive in the dark. Readers comparing land-border timing with airport reentry planning may find this related Baja Times explainer on airport immigration waits useful for thinking about buffers.
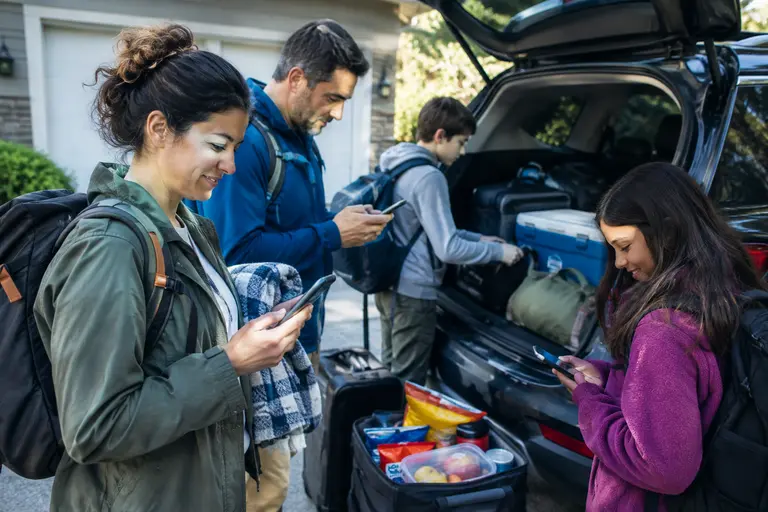
For family road trips, the planning burden is less about the average wait and more about the longest tolerable wait. A 45-minute delay may be fine with snacks, fuel, and a flexible arrival. A four-hour delay can become a different trip entirely if travelers have pets, children, refrigerated items, mobility needs, or a late-night highway segment still ahead.
What Changed On Canada And Mexico Corridors
Canada Traffic Shows Stronger Vehicle Demand
The Canada-side July data points to stronger personal-vehicle demand than one year earlier. That matters for travelers using northern road-trip corridors because higher monthly volume can translate into more peak-period stress, even when day-to-day processing is efficient. The research also notes sharp pedestrian increases earlier in 2026 in the Buffalo-Niagara Falls area, with reported year-over-year gains in April, May, and June. Those figures point to a corridor where demand can change quickly by season and event timing.
Technology can help, but it should not be seen as a cure for every delay. A Niagara-region deployment found that average delays for U.S.-bound trucks at two crossings fell 46% during June through August 2024 compared with the same period in 2023, while Canada-bound truck delays fell 37%. The same project found smaller but measurable passenger-vehicle reductions, according to the ITS Deployment Evaluation. That evidence supports the idea that better information and traffic management can reduce delay, but it does not remove the need for traveler-level planning.
Mexico Crossings Need Port-Specific Thinking
Mexico-to-U.S. personal-vehicle entries fell slightly in July 2026 compared with July 2025, but the late-October snapshots still showed severe delays at some ports. This is the key planning distinction: monthly volume and live delay are related, but they are not the same. A lower-volume month can still produce a difficult crossing day if traffic concentrates at a popular port.
Commercial crossings also add context. The research notes that Laredo, Texas, received about 610,376 trucks from Mexico in September 2026, down 4.0% from September 2025. For passenger travelers, that does not directly predict a car-lane wait. It does, however, show that border movement changes by mode. Trucks, buses, pedestrians, and personal vehicles each respond to different economic, seasonal, and travel patterns.
Trip Decisions For Drivers, Families, And Pedestrians
Choose The Crossing For The Trip You Are Actually Taking
A scenic road trip, a work return, a medical visit, and an airport transfer should not be planned the same way. If the trip has a hard deadline after the border, the safest planning choice is usually the one with the widest time cushion, not the route that looks shortest on a map. If the trip has no fixed arrival, travelers may be able to wait out a peak or use the delay as a reason to shift meal timing before joining the line.
Pedestrians should also avoid assuming that car delays explain foot crossings. The July 2026 data showed different movement by mode, including a slight increase in Canada-to-U.S. pedestrian entries and a large decline in bus crossings. That means a traveler crossing on foot, by bus, or by private vehicle may face a very different experience on the same day.
What To Check Before Leaving
Before setting out, travelers should confirm the active port, lane type, documents, vehicle requirements, and same-day delay reports. The research does not provide fees or document-rule changes, so travelers should not infer new costs from these volume figures alone. The real cost risk is time: missed reservations, late arrivals, extra fuel use, and the fatigue that comes from driving after a long wait.
For broader travel planning and practical trip habits, readers in the same network can also check Silver Liners travel notes for advice on longer multi-stop itineraries.
Border Wait Times Update For Cross-Border Trips
The most useful reading of the late-October 2026 update is cautious rather than dramatic. Canada-to-U.S. personal-vehicle entries were up in July 2026, Mexico-to-U.S. personal-vehicle entries were slightly down, bus crossings dropped sharply, and specific same-day Mexico crossing snapshots still showed delays ranging from manageable to severe. That combination means Border Wait Times should be treated as a planning variable, not a fixed expectation.
For travelers, the practical move is to plan with three layers: official volume trends for context, same-day delay reports for timing, and personal buffers for missed connections or late arrivals. No single statistic can make a crossing predictable. A better plan accepts uncertainty, protects the most time-sensitive part of the trip, and avoids treating a border queue as just another short stop on the road.